
Last updated: August 13, 2026. Every figure on this page was re-fetched from its primary source on that date; the source list at the bottom links each one.
The headline numbers
Remote online notarization (RON) in 2026 is a legal success and a usage laggard. The laws are almost everywhere; the transactions are not. Four numbers frame the whole report:
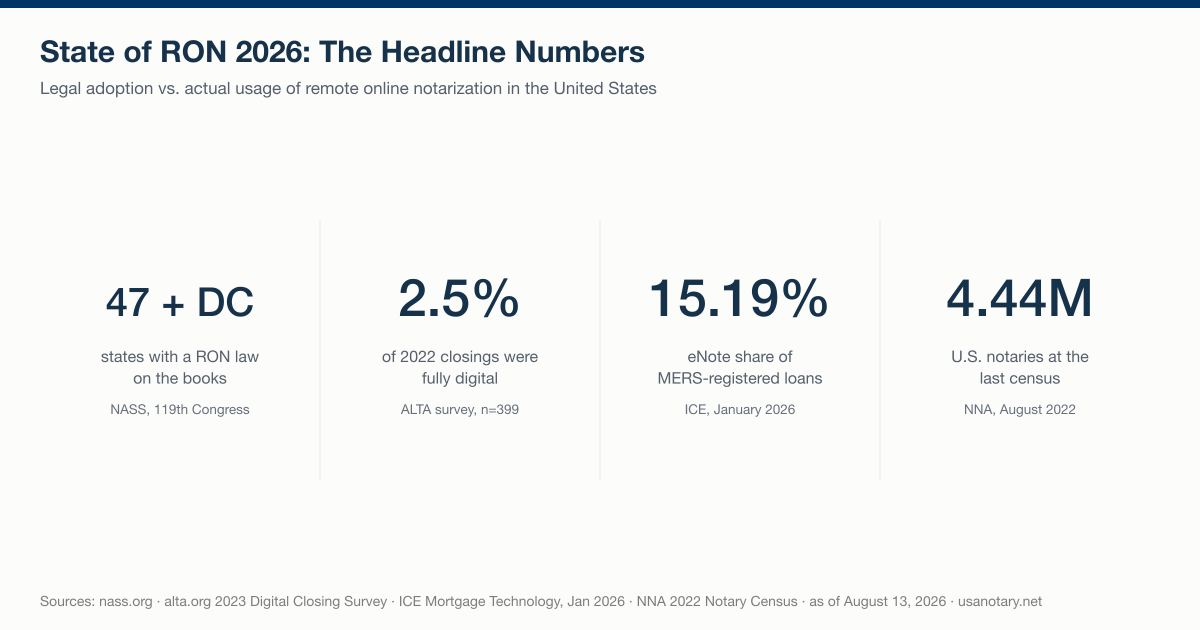
- 47 states plus the District of Columbia have a RON law — the National Association of Secretaries of State’s current count, fifteen years after Virginia became the first state to authorize remote e-notarization in 2011.
- 2.5% of real-estate closings were fully digital in 2022 — per ALTA’s survey of 399 title professionals, up from 2.2% the year before.
- 15.19% of loans registered on the MERS System were eNotes in January 2026 — an all-time high, per ICE, whose MERS eRegistry passed 3 million cumulative eNotes in 2026.
- 4,442,904 notaries held U.S. commissions at the 2022 NNA census — a slight decline from 4,488,252 in 2017, and still the most recent national count anyone has.
The gap between line 1 and lines 2–3 is the story of this report. The sections below walk through the adoption gap, the state-by-state legal map, the fee premium states write into their RON statutes, where the notaries actually are, and the federal statistic that doesn’t exist.
Legal everywhere, used almost nowhere
RON’s legal rollout took a decade and finished fast. For where each state stands today, see our state-by-state legality guide. The NASS timeline runs:
- 2011 — Virginia authorizes remote e-notarization, the first state to do so
- 2015 — Montana follows
- 2017 — Nevada and Texas enact RON laws
- 2018–2021 — the pandemic-era wave: most remaining states pass permanent RON statutes
- 2026 — 47 states plus DC have a RON law (NASS); the SECURE Notarization Act (HR 1777) is pending in the 119th Congress to authorize remote notarization nationwide
Usage never caught up with legality. ALTA’s October 2023 survey — 399 title professionals and businesses across 46 states and DC — found digital or hybrid closings reached 10% of all transactions in 2022 (versus 7% in 2021), but fully digital closings were just 2.5%. The same survey names the bottleneck precisely, and it isn’t the notaries. The barriers respondents ranked:
- Lack of lender acceptance — 84%, the top obstacle by a wide margin
- Insufficient testing with lenders — 79%
- Lack of consumer technology capabilities — 78%
The demand side of that survey is the optimistic part: more than two-thirds of the companies surveyed expect digital closing volume to increase, 44% of the businesses not yet offering RON plan to implement it, and over 76% of businesses already using RON said they would expand their use if lenders sent more requests. The capacity is waiting on the pipeline.
The lender-side data says the same thing from the other direction. Snapdocs’ 2025 State of eClose Adoption Report (100 mortgage lending institutions, published April 2025) found 90% of lenders now offer digital closings — yet only 14% of lenders with eClosing technology close more than 80% of their loans digitally. Offering the technology and using it remain very different things.
The strongest adoption signal in the dataset is the eNote curve. ICE announced in 2026 that the MERS eRegistry surpassed 3 million cumulative eNotes, and its companion analysis reports the industry average reached 15.19% of all loans registered on the MERS System in January 2026 — an all-time high, with leading lenders registering between 30% and 80% of their originations as eNotes each month. An eNote is not a RON (it is the digital promissory note; the notarization is a separate act), but the two travel together in a fully digital closing, which makes the eNote share the best frequently-updated proxy the industry publishes.
Notary-side numbers point the same way. In the NNA’s 2022 census survey, 27% of responding notaries said they were authorized to perform remote notarizations — and nearly half of those had performed five or fewer. (That is a self-selected survey of respondents, not a measured attribute of all 4.4 million notaries; provenance matters, so we label it.) One platform datapoint for scale: NotaryCam, a Stewart-owned company, reported completing more than 154,000 RONs in 2024 — a company-reported figure cited on ALTA’s digital-closings page.
Consumer preference is part of the explanation. A 2022 consumer mortgage-experience survey of more than 1,000 participants, cited on ALTA’s advocacy page, found about 81% of borrowers want a face-to-face closing while 19% prefer remote online notarization. That is a vendor-run survey, not an ALTA study — but no published survey we could verify shows a majority preferring remote.
One number you will not find here: RONs performed per year in the United States. No such national statistic exists — the NNA states plainly that the data is not available. Any article quoting a precise national RON volume is quoting an estimate, not a measurement. We use labeled proxies (ALTA’s closing shares, ICE’s eNote share, NotaryCam’s platform count) instead.
How many states allow RON? Depends on who’s counting
“How many states allow RON” has at least four defensible answers in 2026, because the major trade bodies count different things. The reconciliation:
| Count | Who says it | What is being counted |
|---|---|---|
| 47 states + DC | NASS (National Association of Secretaries of State) | States with a law that allows remote e-notarization |
| 48 states + DC | ALTA (American Land Title Association) | States that passed a RON law or issued an executive order (some did both) |
| 45 states + DC | MBA (Mortgage Bankers Association) | States whose RON laws are usable for real-estate finance — Connecticut enacted RON with an exclusion for real-estate transactions |
| 42 of 50 states | USA Notary 50-state review (July 2026; Connecticut reclassified October 2026) | States where a consumer can actually complete a RON under that state’s own law today; 2 more (Alabama and Connecticut) allow only a limited, paper-output remote act |
All four are correct within their own definition. A state can have a RON law on the books that is not yet operational — California is the canonical example, and our July 2026 review also classified Georgia, Massachusetts, Mississippi, North Carolina, and South Carolina as not yet operational under their own laws. (Signers in those states can still often use an out-of-state online notary, because the notary’s commissioning state authorizes the act — the signer’s location doesn’t have to.)
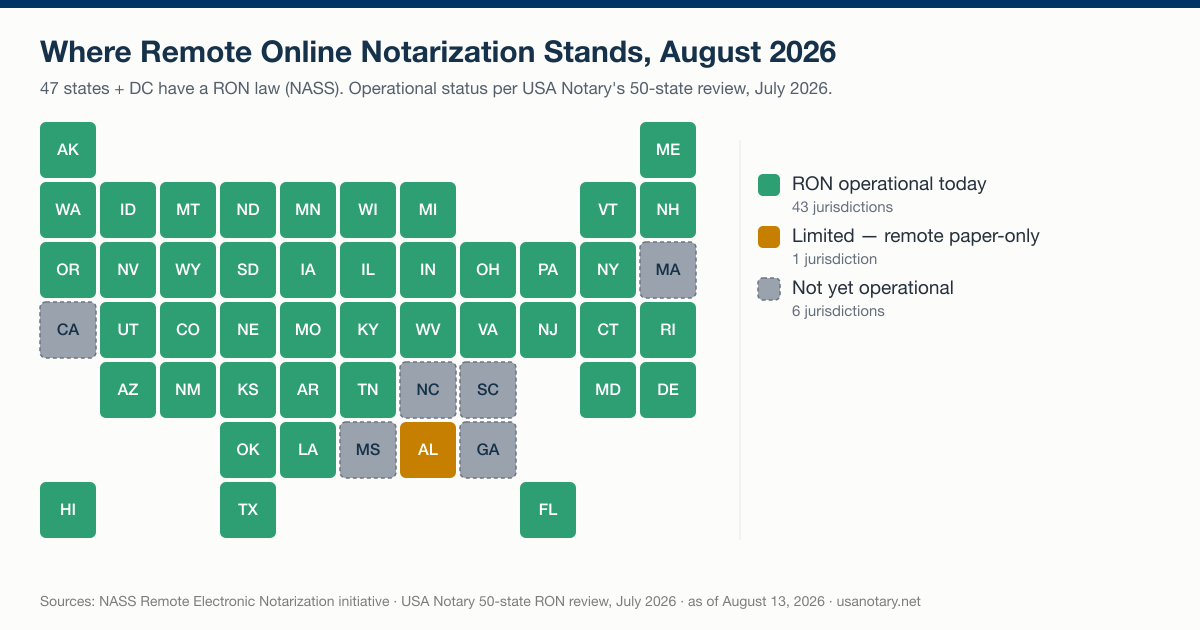
Operational status per USA Notary’s 50-state RON review (July 2026); NASS separately counts 47 states + DC with a RON law on the books. As of August 13, 2026.
The practical takeaway for anyone citing a number: never quote “X states allow RON” without the definition attached. The sources genuinely disagree, and each is measuring something real.
The RON fee premium: states price online notarization at a multiple
State legislatures did something quietly interesting when they wrote RON statutes: they set RON fee caps far above the in-person caps that, in some states, had not moved in decades. This section is computed from USA Notary’s own 51-jurisdiction statutory fee table — the dataset behind our state guides, verified in July 2026 against primary state statutes and cross-checked to the NNA’s “2026 Notary Fees By State” page (last updated July 1, 2026; re-checked August 13, 2026).
The method, in one paragraph: of the 51 jurisdictions (50 states + DC), 32 set a defined dollar cap for both the in-person act and the RON act. We compute the multiplier only over those 32. Excluded and disclosed: 9 jurisdictions cap neither act (Alaska, Arkansas, Iowa, Kansas, Kentucky, Louisiana, Maine, South Dakota, Vermont), 6 have no operative RON fee (California, DC, Georgia, Massachusetts, Mississippi, South Carolina), 2 allow only paper-output remote acts (Alabama, Connecticut), New Jersey publishes a range rather than a single cap, and Massachusetts/Tennessee lack an in-person cap. Several states also permit an added technology fee on top of the base RON cap; multipliers below use base caps only, with the add-on flagged.
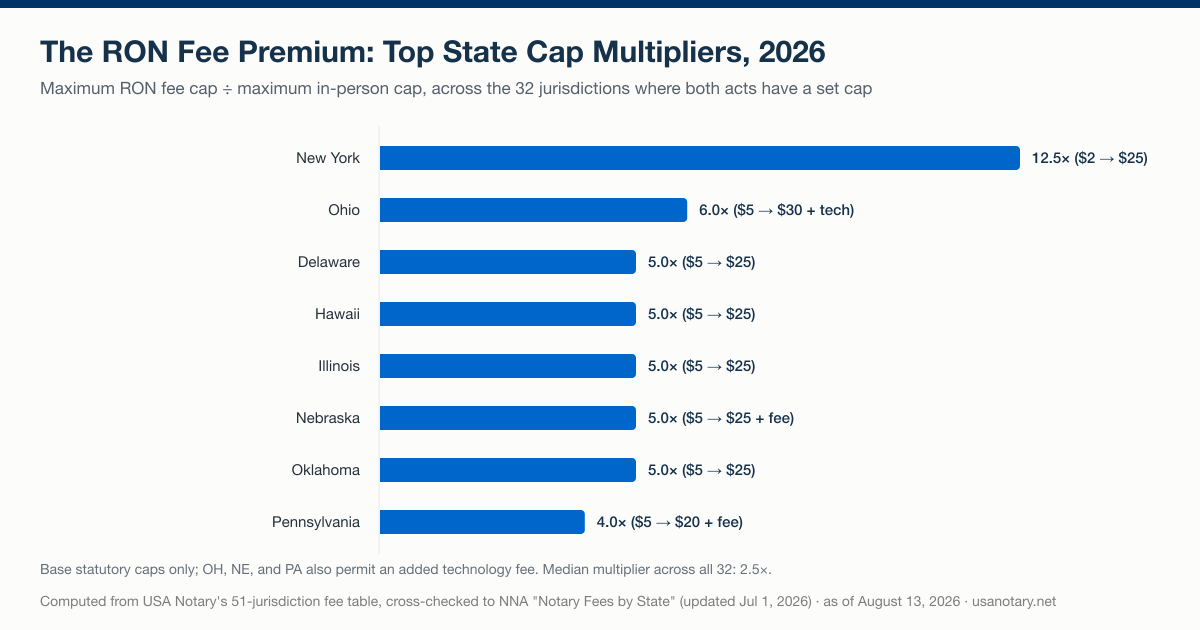
The findings, from the computed table:
| Finding | Value (as of August 13, 2026) |
|---|---|
| Largest premium | New York: 12.5× — $2 in person vs. $25 online |
| Next largest | Ohio 6.0× ($5 → $30 + tech fee); Delaware, Hawaii, Illinois, Nebraska, Oklahoma all 5.0× ($5 → $25); Pennsylvania 4.0× ($5 → $20 + fee); Maryland 3.75× ($8 → $30) |
| Median multiplier (all 32) | 2.5× |
| Jurisdictions where RON cap > in-person cap | 20 of 32 |
| Jurisdictions with identical caps | 12 of 32 (e.g., Arizona $10/$10, Minnesota $5/$5, Rhode Island $25/$25) |
| Most common RON cap | $25 — 19 jurisdictions |
| Most common in-person caps | $5 (16 jurisdictions) and $10 (15 jurisdictions) |
The pattern is legible: legislatures treated RON as a distinct, technology-bearing service and priced it accordingly, while in-person caps — New York’s $2 dates from another era entirely — stayed frozen. For a working notary, the statutory ceiling on a single online act is typically 2.5 to 5 times the ceiling on the same act performed in person.
Two caveats keep this honest. First, a cap is a ceiling, not a market price — a notary may charge less, and platform economics (what a platform pays out or charges per session) usually matter more than the statute, which is exactly what our pricing study of what seven online notary platforms publish documents on the consumer side. Second, several RON caps carry ”+ technology fee” language whose value the statute doesn’t fix; our multipliers ignore those add-ons rather than guess at them.
Notaries per capita: an 8× spread between states
Notary supply is wildly uneven, and almost nobody looks at it. The NNA’s 2022 census population chart — the only national per-state count — puts the national average at 1,340 notaries per 100,000 residents, with an eight-fold spread between the extremes:
| State | Notaries (2022) | Per 100,000 residents |
|---|---|---|
| South Carolina | 151,452 | 2,959 — the densest state |
| Florida | 474,670 | 2,204 |
| New Jersey | 196,199 | 2,112 |
| Texas | 484,230 | 1,661 |
| National | 4,442,904 | 1,340 |
| New York | 278,741 | 1,380 |
| Pennsylvania | 72,575 | 558 |
| Utah | 14,838 | 454 |
| California | 147,714 | 374 — the sparsest large state |
| Hawaii | 5,274 | 362 |
Texas holds the largest absolute count (484,230, up 56,674 since 2017), narrowly ahead of Florida (474,670, down 21,221). The biggest five-year movers were New Jersey (+61,785 — the largest gain of any state, expanding its notary corps by nearly half) and Pennsylvania (−41,612 — the largest decline; the state’s own Department of State described the drop as part of a natural commission cycle). The national total fell 45,348 between the 2017 and 2022 censuses — the notary population is stable-to-shrinking even as RON authorization spread to nearly every state, which is worth holding next to the adoption numbers above: the online transition so far has redistributed notarial work more than it has expanded the profession.
A dating note that aggregator articles routinely get wrong: these are 2022 census figures, the most recent national count in existence — citing 4.44 million as a “2026” number is an error. The NNA runs its census every five years, so a 2027 refresh is the next scheduled measurement, and no federal or state agency publishes a rolling national count in the meantime.
Cross the density column with the fee-cap table above and you get something no trade body publishes: a sketch of each state’s statutory earning environment — how much competition a notary faces versus how much the state lets each act earn. The extremes are instructive. South Carolina packs the nation’s densest notary population into a state where RON isn’t yet operational and the in-person cap is $5 — maximal competition, minimal ceiling. California is the mirror image: the sparsest large-state supply (374 per 100k) but likewise no operative RON — a big market with the online lane closed in-state. New York combines mid-pack density with the country’s most lopsided caps ($2 in person, $25 online): the statute itself pays New York notaries to move online. And Pennsylvania — density collapsing (−41,612) with a 4× RON premium — looks like the cleanest “fewer competitors, better online ceiling” environment in the table. These are statutory ceilings crossed with census-year counts, not income data; treat the index as a map of conditions, not a promise of earnings.
The missing federal statistic
The federal government does not measure notaries. The Bureau of Labor Statistics publishes no notary-specific occupation code or wage series — so every “average notary salary” article you have read is built on proxies or self-reported survey data, whether it says so or not.
The closest BLS code is 43-4031, Court, Municipal, and License Clerks: 157,960 employed, median annual wage $46,110, mean $48,760, as of May 2023. It is a poor stand-in twice over. First, it describes salaried government clerks, not commissioned notaries running signing businesses. Second — and this is printed in the BLS’s own footnote — the estimates exclude self-employed workers, which is precisely what mobile notaries and most online notaries are. We report the figure here so you can recognize it when it is misused, not so you can use it: there is no BLS notary salary.
The same gap runs through the whole field: no federal notary count (the NNA’s five-yearly census is the only national number), no national RON transaction volume, no official income series. An industry processing millions of legally required acts a year is, statistically speaking, invisible to Washington. Reports like this one exist to fill that gap with labeled, checkable proxies — and to flag the unlabeled ones.
What the 2026 numbers mean for working notaries
The data reads differently depending on which side of the webcam you sit on. For a commissioned notary, three conclusions fall out of it:
- The legal map is nearly done; the demand curve is just starting. With 47 states + DC authorized (NASS) but fully digital closings at 2.5% and the eNote share at 15.19% and climbing, RON in 2026 looks like infrastructure built ahead of traffic. The notaries positioned before the traffic arrives keep the early volume.
- The statute sets a generous ceiling; the platform decides your share of it. A $25 RON cap means little if the platform you work through takes most of it, charges you to be found, or never sends you work at all. Platform economics — payout schedules, subscriptions, who actually routes signings — vary far more than state caps do. Our comparison of the best RON platforms for notaries lays those numbers side by side from each platform’s own published pages.
- Where you commission matters more than ever. An 8× density spread and a 12.5× fee-premium spread mean the same effort earns very differently across state lines. If you’re not yet commissioned, the state-by-state guides to becoming a notary cover eligibility, costs, and each state’s RON registration.
Disclosure, since this report feeds our own funnel: USA Notary operates a two-sided RON platform. Membership assigns paid signing sessions to member notaries — assignment is availability-based — and includes SharpNote tools to bring, keep, and serve your own clients. Members pay a monthly tier plus a per-session fee, published in full on the membership pricing page. None of the figures above depend on that affiliation; all of them are sourced outside it.
Methodology
USA Notary compiled this report on August 13, 2026. The rules we followed:
- Every figure was re-fetched from its primary source on the capture date. Nothing is quoted from memory or secondary coverage; the source list below links every page and PDF, each with its retrieval date.
- First-party computation is labeled as ours. The fee-premium analysis is computed from USA Notary’s 51-jurisdiction statutory fee table (verified July 2026 against primary state statutes, cross-checked to the NNA’s fees page as updated July 1, 2026). The multiplier covers only the 32 jurisdictions where both acts have a defined cap; all exclusions are itemized in that section. The operational-status map uses USA Notary’s July 2026 50-state review, whose definitions are stated in the map’s caption.
- Survey data is labeled as survey data. ALTA’s closing shares come from a 399-respondent survey of title professionals; Snapdocs’ figures from its 100-lender study; the NNA census demographics from self-selected survey respondents. None of these are measured market totals, and the report never presents them as such.
- Counts carry their definitions. Where sources disagree (the 47/48/45/42 state counts), we print the reconciliation instead of picking a winner.
- Known-absent statistics are stated as absent. There is no BLS notary occupation series and no national RON-transactions-per-year measurement; the report says so rather than substituting an estimate.
- Census figures are dated to their census. The 4,442,904 notary count is the NNA’s 2022 census, not a 2026 count; the next census is due in 2027.
Reuse is welcome with attribution: USA Notary, “State of RON 2026,” August 2026, usanotary.net. If a source has published a newer figure since August 13, 2026, the source’s live page controls.